qEEG Documentation — March 2015
The Brain Mapping
Record
In March 2015, Kurtis Todd sat in a clinic in Sarasota while a neurologist mapped his brain in three states — resting baseline, and two deliberately induced meditative states. What the instruments recorded fell categorically outside the parameters of ordinary clinical experience.
Three states. Two results that had no precedent. A quantitative electroencephalogram — measuring amplitude, frequency, and inter-regional synchronization — was the instrument.
Three states. Two results that had no precedent. A quantitative electroencephalogram — measuring amplitude, frequency, and inter-regional synchronization — was the instrument.
The normal adult brain produces electrical activity ranging from approximately
10 to 100 microvolts on the scalp, with most waking states operating between
10 and 50 μV. Alpha waves — the signature of calm, alert wakefulness — typically run
below 50 μV in posterior regions. These figures are well established across decades of
clinical electroencephalography.
The session documented here recorded three distinct brain states. The baseline reading
placed the author's brain squarely within normal parameters. What followed did not.
qEEG Scans — All Three States
Row 1
Topographic head maps — amplitude distribution across scalp regions
Baseline · Head map
Meditative State A · Head map
Meditative State B · Head map · 700+ μV
Row 2
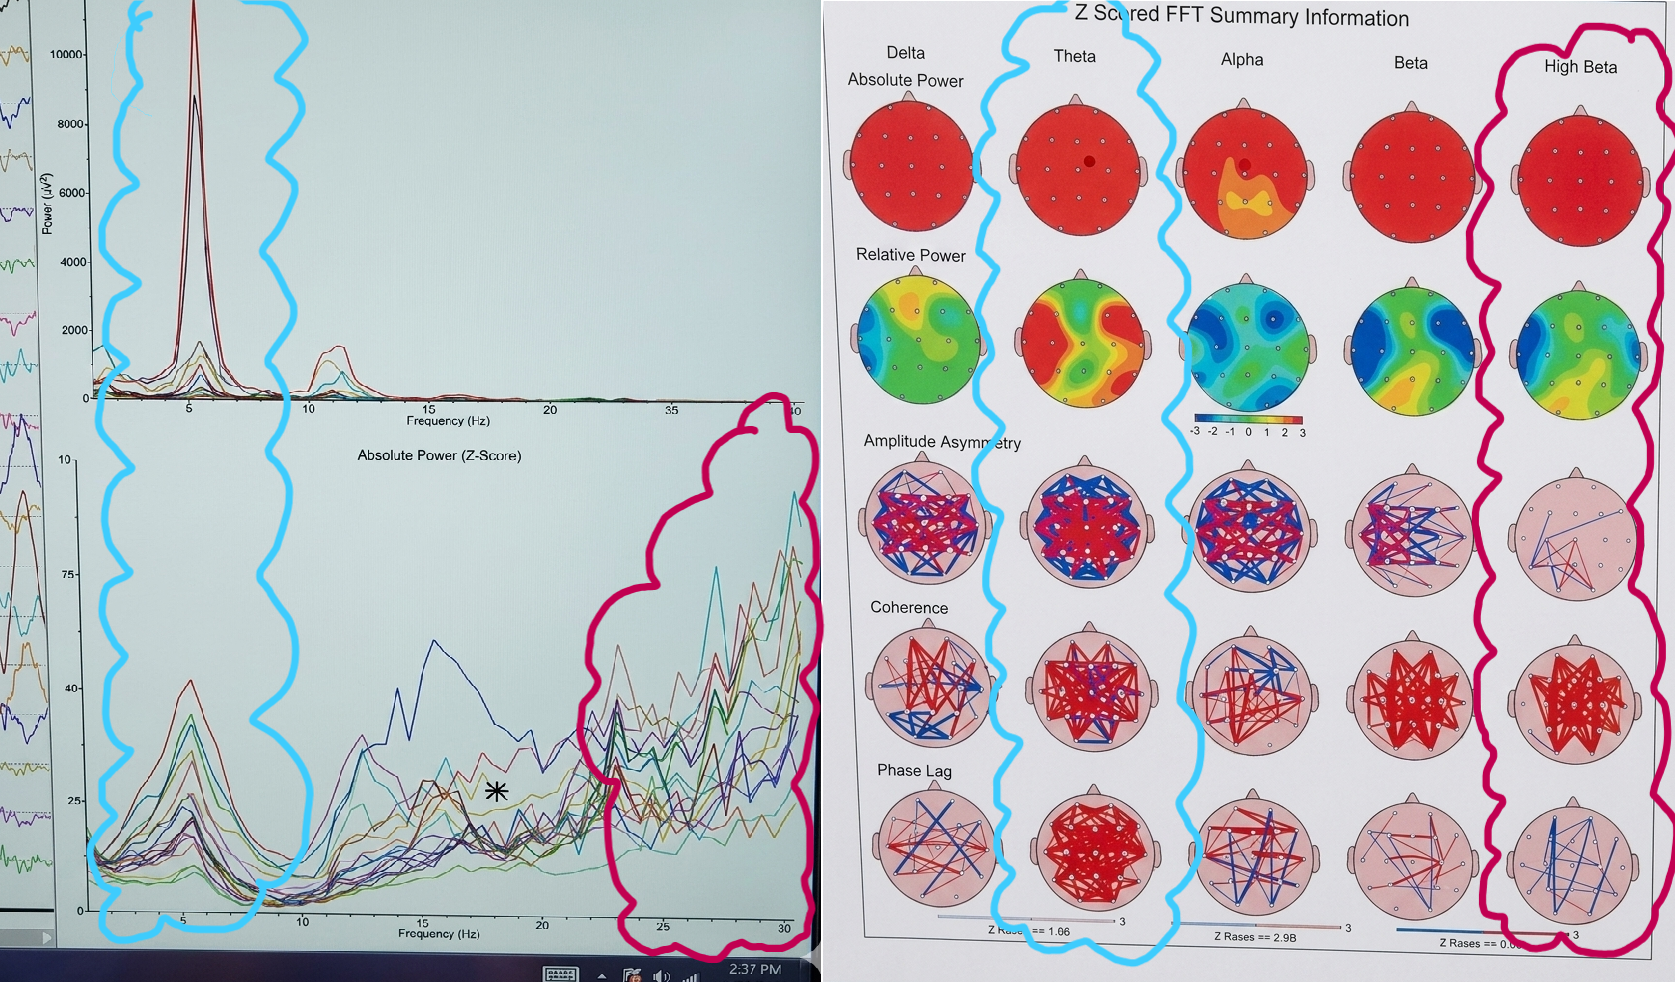
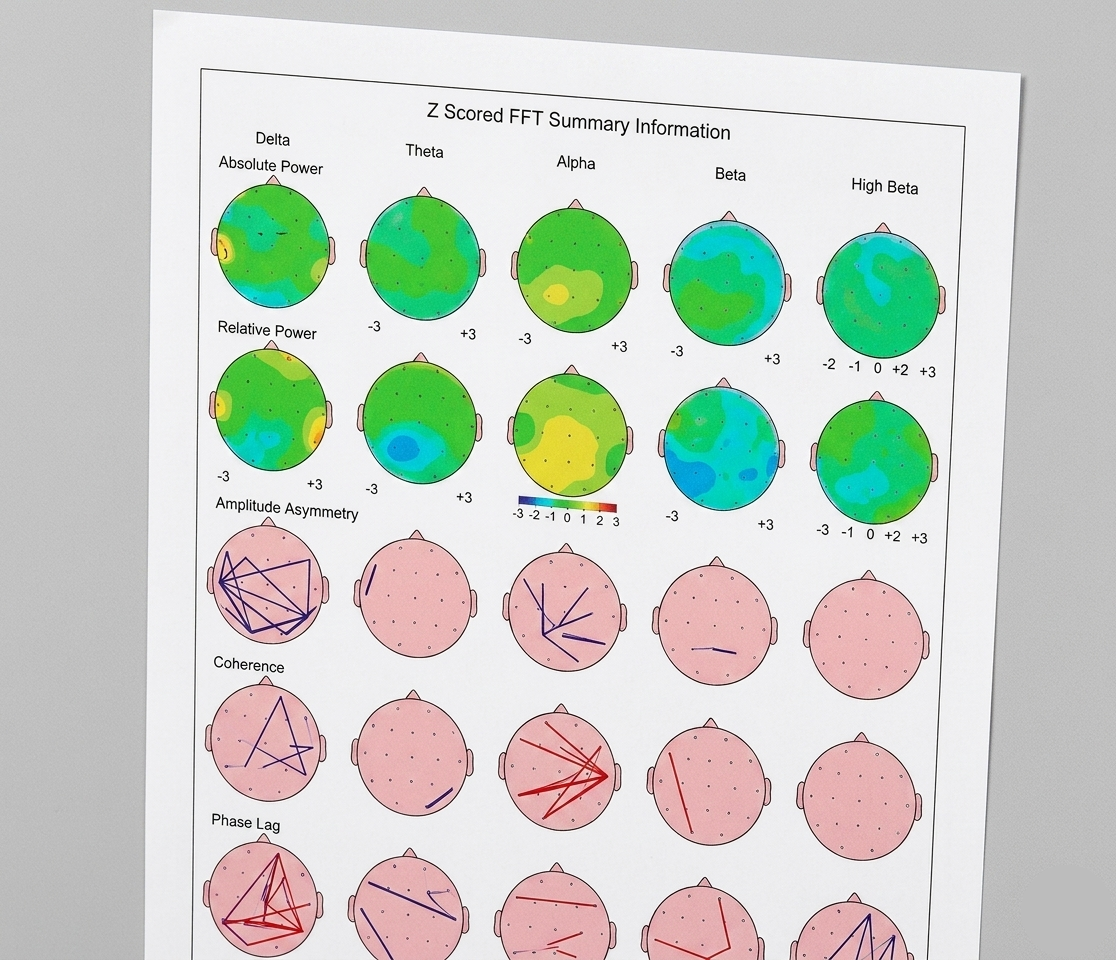
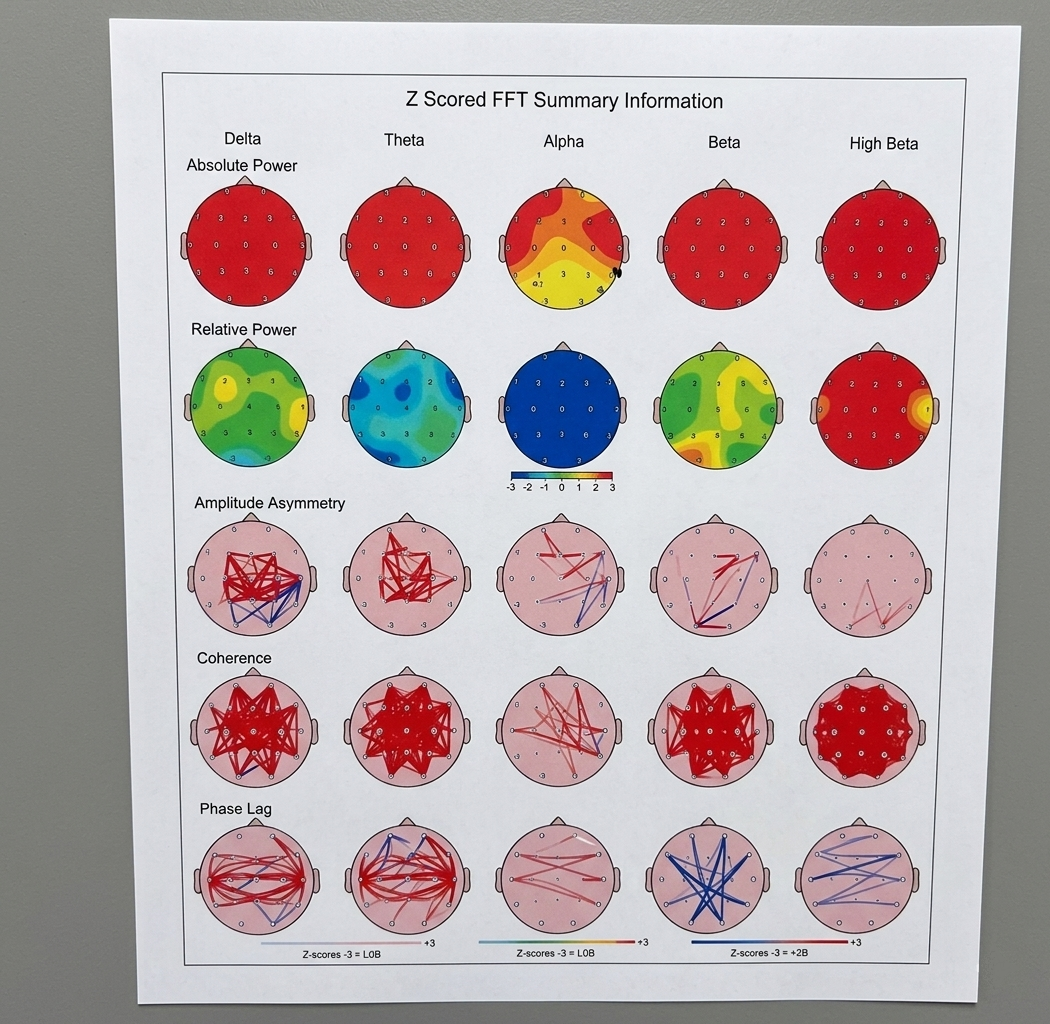
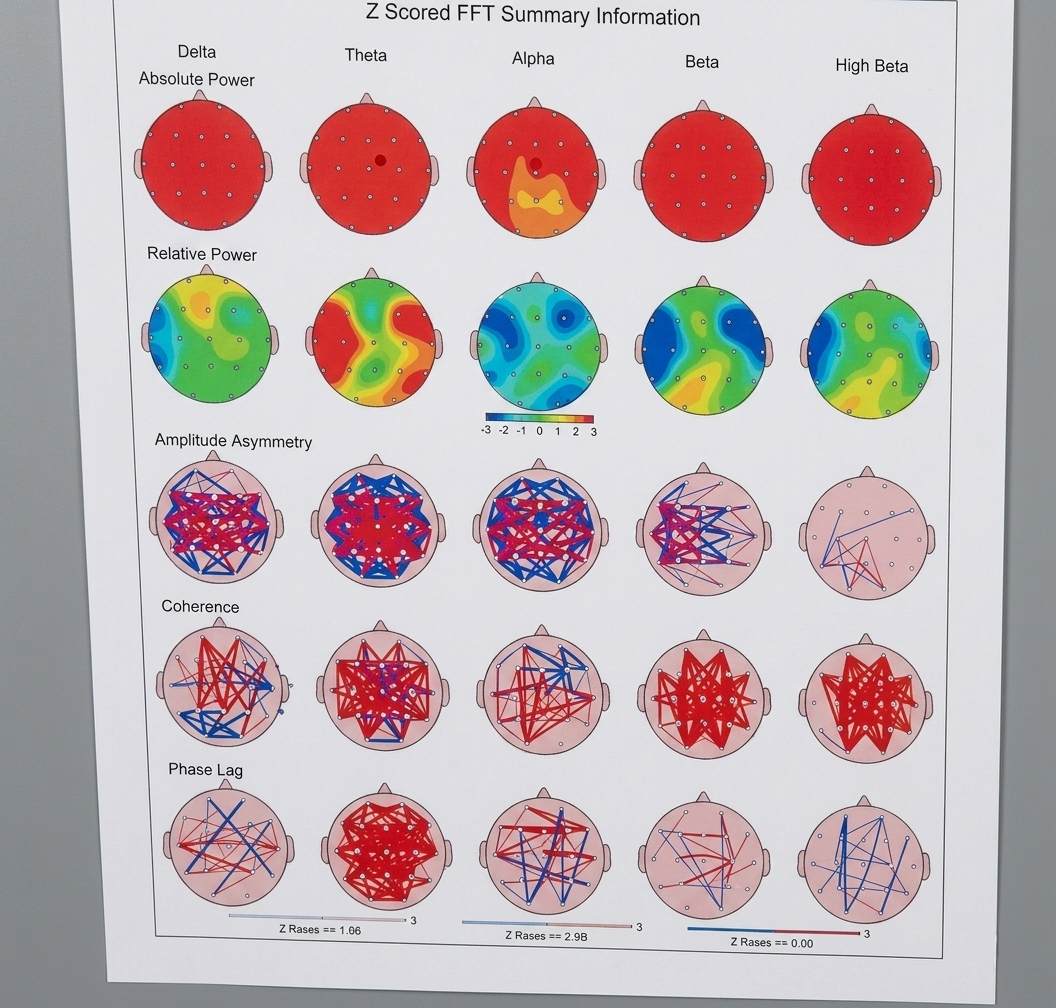
Z-score and frequency band analysis — deviation from population norms
Not applicable
Z-score and frequency graphs were recorded for the two induced states only, not the resting baseline.
Baseline · No frequency graph
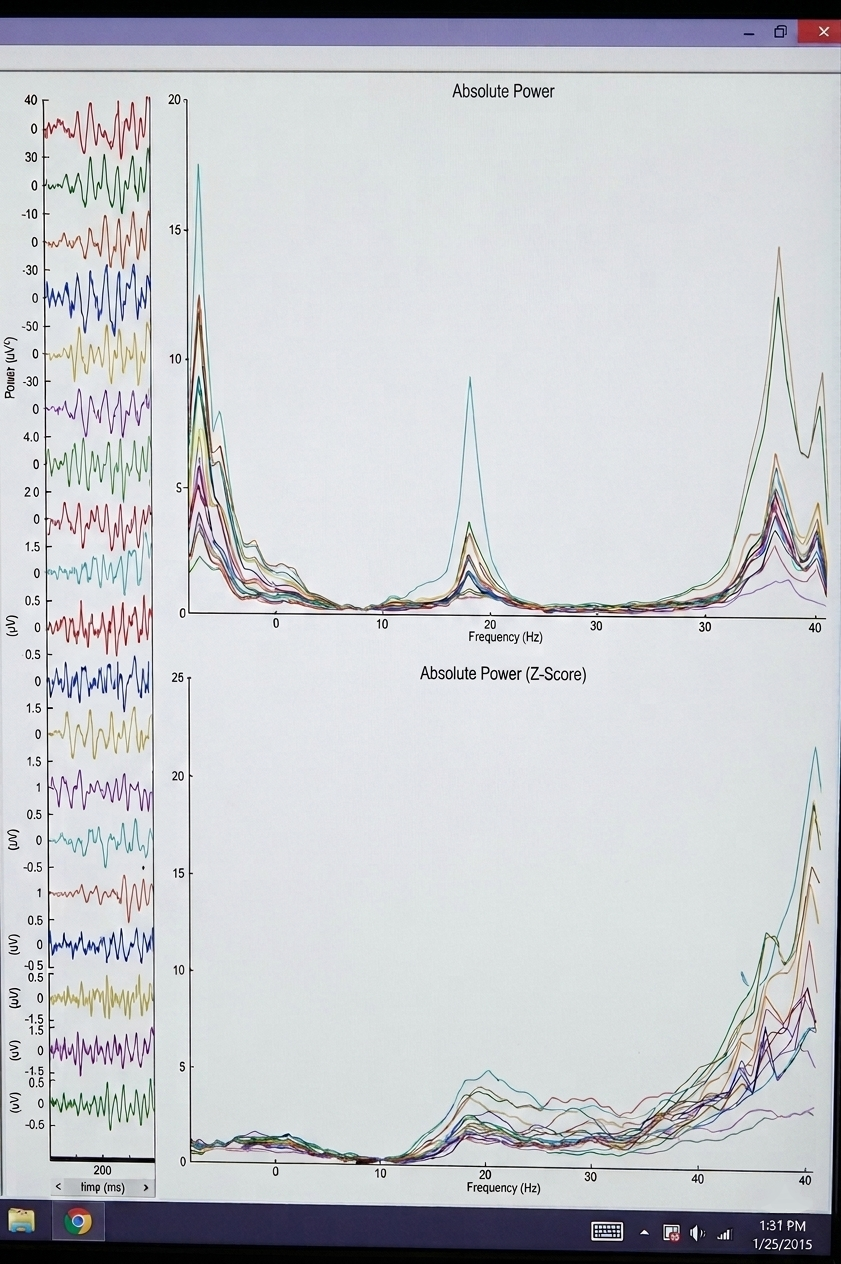
Meditative State A · Z-scores & frequency
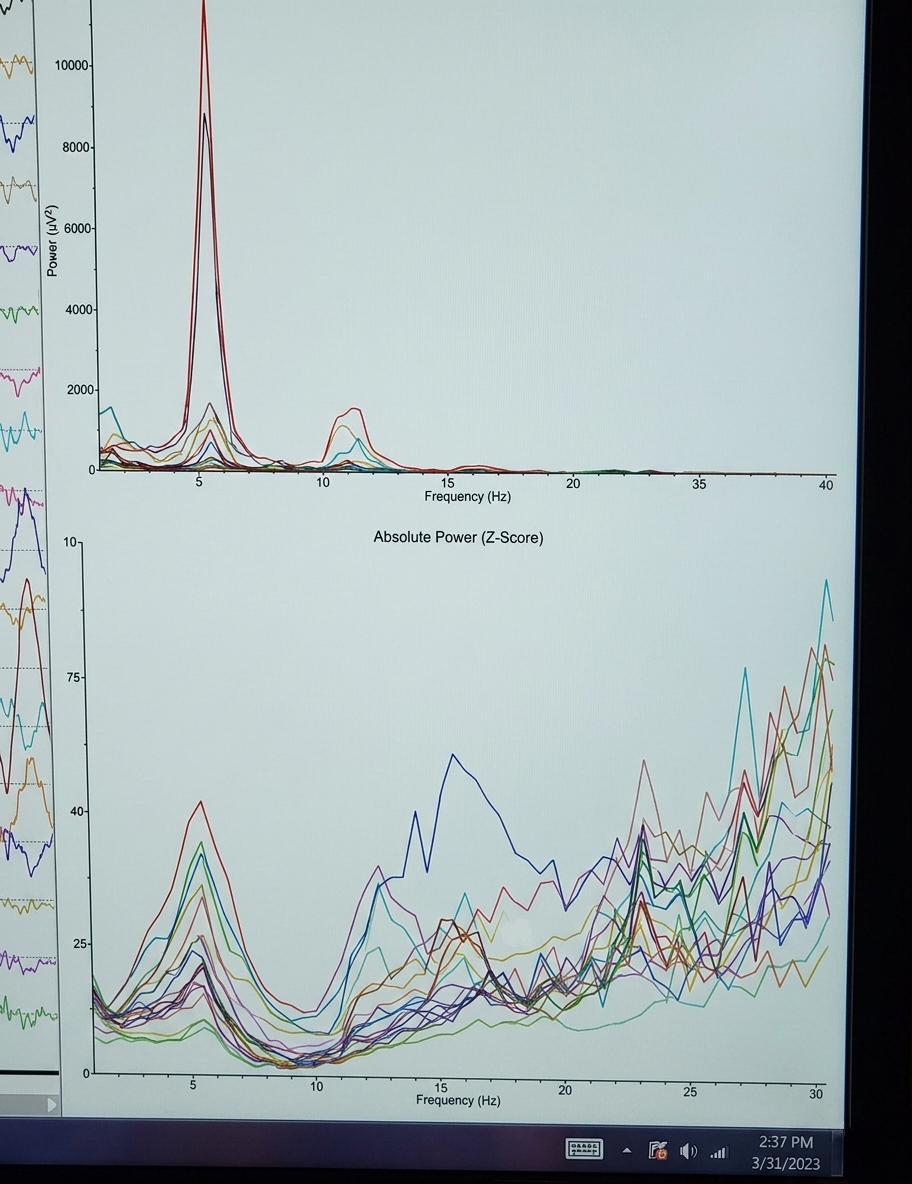
Meditative State B · Z-scores & frequency
All scans recorded March 2015 · Sarasota, Florida · Quantitative Electroencephalogram (qEEG)
"I drove home that evening no longer wondering. The instruments had seen what I had felt.
What I had been experiencing was not a narrative I was constructing to comfort myself.
It was not mysticism. It was not self-delusion. It was measurable, physical, and real —
documented in the most literal and empirical and gloriously undeniable sense of those words."
"The question I turned over the entire drive home was the only one that had ever really mattered:
what is actually happening here, and why?"
— from the Preface, Infinitely Simple